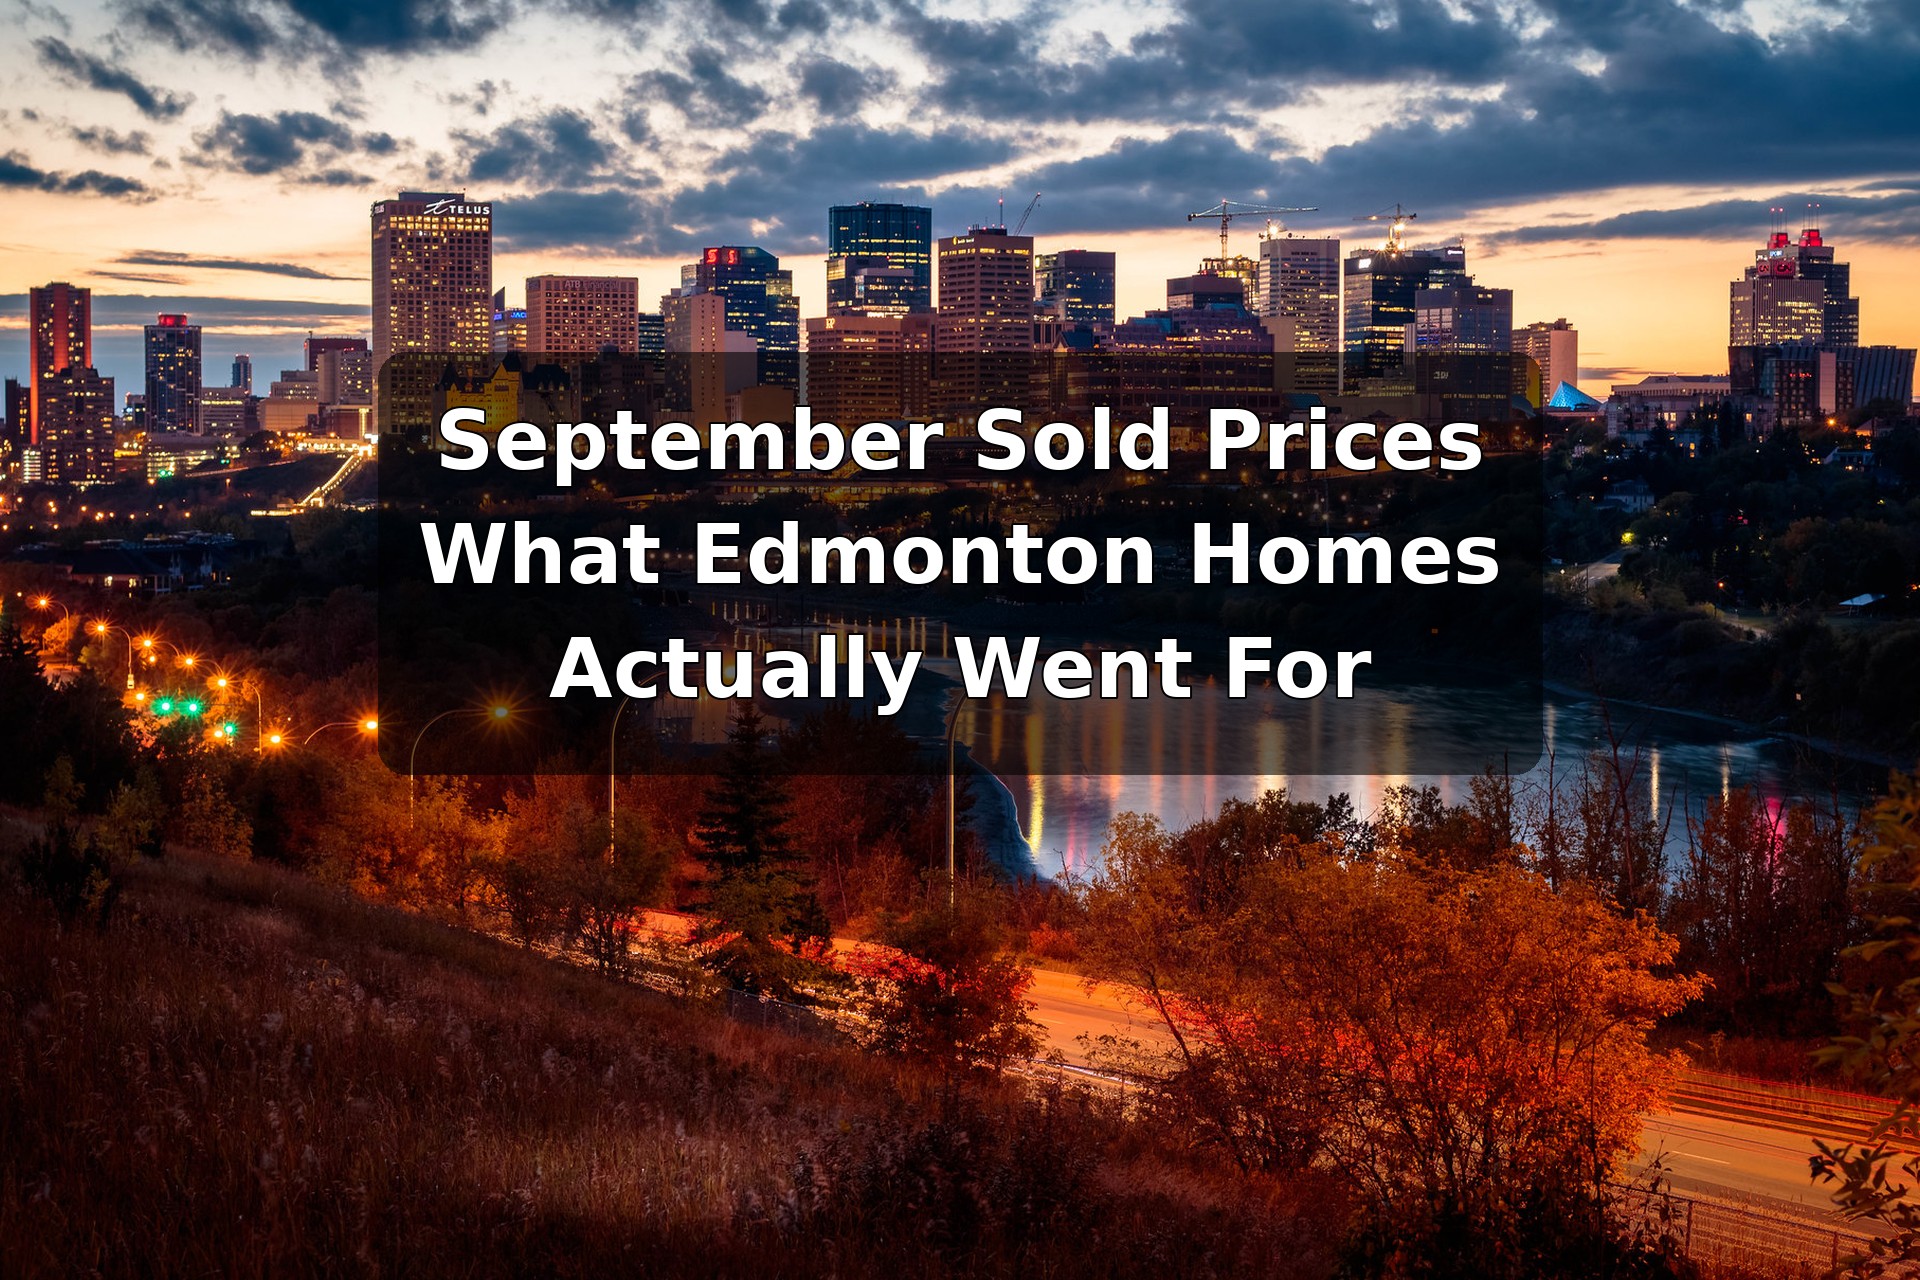
September Sold Prices: What Edmonton-Area Homes Actually Went For
September’s numbers are in: 1,959 sales — down 10.3% from last September — against 3,864 new listings, with inventory running 16.7% above a year ago. The board chair says sales won’t rebound until after year end. Here’s what the shift means if you’re thinking of selling.
By YEG.Homes · Updated October 6, 2026On this page
- September by the numbers
- Why sales slowed while listings kept climbing
- What the shift means for sellers
- Prices by property type
- If you’re listing this fall
- Key takeaways
- Frequently asked questions
September by the numbers
The REALTORS® Association of Edmonton released its September 2026 figures on October 2. The headline: fewer sales, more listings, and the biggest inventory cushion buyers have had in recent memory.
| Metric | September | vs August | vs last September |
|---|---|---|---|
| Sales | 1,959 | −8.8% | −10.3% |
| New listings | 3,864 | +7.2% | +11.3% |
| Inventory | — | +0.1% | +16.7% |
| Average price (all residential) | $466,080 | −0.8% | +2.9% |
| MLS® HPI benchmark | $423,100 | −0.9% | −0.3% |
Why sales slowed while listings kept climbing
The fall slowdown is a familiar seasonal pattern. Board chair Darlene Reid put it plainly: sales slowed “with the arrival of the new school year,” and in her words, they “will not rebound until after year end.” Buyers step back in September; sellers keep listing.
And sellers did keep listing: 3,864 new listings hit the market, up 11.3% on last September. With buyer activity cooling and supply still arriving, inventory finished the month 16.7% above a year ago — real choice for buyers, real competition for sellers.
Reid also flagged what that competition does to prices. Average prices are “still holding onto the gains” made this year, she noted, but year-over-year price growth has slowed over the last few years — and rising inventory, in her assessment, “could soften that growth even further.”
What’s unusual isn’t the seasonal dip — it’s the size of the gap: roughly two new listings for every sale. That ratio is what turns a normal fall slowdown into a market where pricing discipline decides who sells and who sits.
What the shift means for sellers
Buyers can compare and wait. With nearly two new listings for every sale, your competition isn’t the home that sold in June — it’s the dozen similar homes listed right now. An optimistic price doesn’t get negotiated down in this market; it gets skipped.
The direction matters more than the level. Yes, the average price is still up 2.9% on last September. But it fell 0.8% in a single month, and the benchmark — the cleaner read on like-for-like value — is now below last September. Momentum is fading, and pricing off last spring’s peak is how listings go stale.
The stale-listing trap is worse now. Launching high and reducing later doesn’t work when buyers have alternatives — it just trains them to wait for your next reduction. Our seller’s CMA guide shows how to build the number from actual sold comparables, and the first-14-days launch guide explains why day-one pricing is the whole game.
The only honest baseline is sold prices. Listed prices are aspirations; closings are evidence. Recently sold homes in Edmonton and area is where your price should start — not your assessment, not your neighbour’s asking price.
Prices by property type
September 2026 averages, all Greater Edmonton Area residential, per the REALTORS® Association of Edmonton.
Detached: most resilient
Detached homes averaged $569,820 — down 1.1% from August but still up 2.9% on last September. New detached listings ran 13.6% above last year while sales fell 6.5%, so even the strongest segment is softening. If you’re selling detached, the market still rewards you — it just no longer forgives sloppy pricing.
Semi-detached: under pressure
Semis averaged $412,974, down 2.7% from August and down 4.8% year over year — one of the few segments with an outright annual price decline. Sales fell 10.9% on last September while new listings surged 25.4%. This is the most competitive corner of the market for sellers right now.
Row/townhouse: the softest segment
Row and townhome prices averaged $289,640, down 2.9% on the month and 4.5% on the year, with sales down 20.1% year over year — the steepest sales drop of any property type. Sellers here are competing hardest for the fewest buyers; pricing to the sold comps is non-negotiable.
Apartment condos: thin supply cushions the fall
Condos averaged $208,672, down 3.1% from August but up 0.6% on last September. Sales fell 15.4% year over year — but unlike every other segment, new condo listings also fell (down 5.3%), which is cushioning prices. Still a buyer-friendly segment, just less crowded than semis and townhouses.
If you’re listing this fall
- Price to the last 90 days of sold comparables. Not your assessment, not your neighbour’s asking price, not what you need to break even. Start with the seller’s CMA guide and build the number from closings.
- Don’t anchor to your assessment. Edmonton assessments reflect values as of mid-2025 and exist to calculate taxes. Assessment vs. market value, explained, so you stop leaving money — or buyers — on the table.
- Launch ready on day one. Photos, decluttering, and the right price all live before the listing does. The first 14 days generate your best shot at competing interest; in a two-to-one listings market, there is no warm-up.
- Know your net before you negotiate. Commission, legal, and moving costs come off the sale price, not on top of it. Run the full cost-to-sell breakdown so your walk-away number is real.
- Be honest about timing. The board chair says sales don’t rebound until after year end — but waiting has carrying costs, and January’s competition may be fiercer. Selling now at a sharp, comp-backed price beats chasing the market down. A free local home evaluation gives you the number before you decide.
Key takeaways
September’s market, per the REALTORS® Association of Edmonton: 1,959 sales (−10.3% year over year) against 3,864 new listings (+11.3%), with inventory 16.7% above last September. Average price held at $466,080 (+2.9% year over year) but slipped 0.8% in a month; the $423,100 benchmark is now below last September. Detached is holding up best; semis and townhouses are the most competitive segments for sellers. The board chair expects no sales rebound until after year end — so if you’re selling this fall, price to the last 90 days of sold comparables and launch ready on day one.
Frequently asked questions
Is Edmonton shifting to a buyer's market?
The September figures lean that way: new listings outnumbered sales nearly two to one, and inventory sits 16.7% above last September. Average prices are still holding this year's gains, so it is not a full buyer's market yet — but the direction of travel favours buyers, which is why pricing discipline matters more than it did in spring.
Did Edmonton home prices fall in September?
Month over month, yes, slightly: the average price slipped 0.8% from August and the MLS benchmark fell 0.9%. Year over year the picture is mixed — the average price is still up 2.9% on last September, while the benchmark is down 0.3%. Prices are essentially flat with softening momentum, not crashing.
When will Edmonton sales pick up again?
According to the REALTORS Association of Edmonton's board chair, not until after year end. Sales typically slow with the start of the school year and follow that seasonal pattern, so a listing launched in October or November should be priced for the market that exists now, not the one that arrives in spring.
Is it still a good time to sell in Edmonton?
Yes — if you price to the comparables. The risk right now is overpricing into a market with plenty of choice: overpriced homes sit, go stale, and sell for less than correctly priced ones. A local comparative market analysis built on the last 90 days of sold homes is the way to find your number.
Which Edmonton home types are holding value best?
Detached homes are the most resilient, averaging $569,820 in September — still up 2.9% on last year. Semi-detached and row/townhouse sellers face the toughest conditions: sales fell 10.9% and 20.1% year over year respectively, and average prices are down year over year in both segments.
Selling into a slower market?
Get a free home evaluation based on what comparable Edmonton homes actually sold for — the number your price should be built on.
Get My Free Home EvaluationThis article is for general information only and does not constitute legal or investment advice. Market figures are September 2026 REALTORS® Association of Edmonton snapshots, not forecasts. © 2026 yeg.homes

Comments:
Post Your Comment: